The problem
A 1 mL syringe driven by a lead-screw stepper can be commanded to any volume. Whether it delivers that volume is a separate question, and the obvious way to check is to weigh the result.
Weighing does not work here. On a 0.01 g balance a 50 µL dispense weighs 50 mg — the balance's own quantisation is ±20% of the thing being measured. Every number would be noise.
There was also a mechanical problem underneath the measurement one. The syringe holds roughly 1 mL of trapped air, with liquid only in the tip, so the plunger compresses gas before any fluid moves. That air spring produces a startup dead zone of about 20 µL — and it is not a fixed constant. It shifts with air volume and tip wetting, which is why two fitting sessions a day apart disagreed by 8% on slope.
Uncalibrated, the system was delivering 27% less than commanded at 50 µL.
Measuring volume with light
The dispense goes into a weighed 1.00 g of water rather than onto a balance pan. At a fixed path length, absorbance depends only on the resulting concentration — so the dilution carries the volume information, and a dye reading recovers a drop the balance could never see.
Build the standard curve
Indigo carmine read at 630 nm, 41 cuvettes from 3–30 mg/L, prepared gravimetrically so every weighed component stays above 2 g. Recovery interpolates through the measured node means rather than the fitted line — the response is measurably concave above 18 mg/L, and the line would bias every reading up there.
A = 0.03504·C + 0.0169 R² = 0.99902Dispense into weighed water
Three bands, each with its own dye strength and speed, so every volume lands in the curve's well-resolved middle instead of near the noise floor or the saturation shoulder. A per-session tare absorbs the overnight offset drift that defeated the single fixed constant.
V = c · V_water / (C_dye − c)Tame the air spring
Below 32 µL, aspirating 2 mm of air behind the liquid clears the last drop and primes away most of the dead zone. That collapses a drifting ~7 µL loss into a constant 1.4 µL offset the fit can simply absorb.
drifting 7 µL → constant 1.4 µLResults
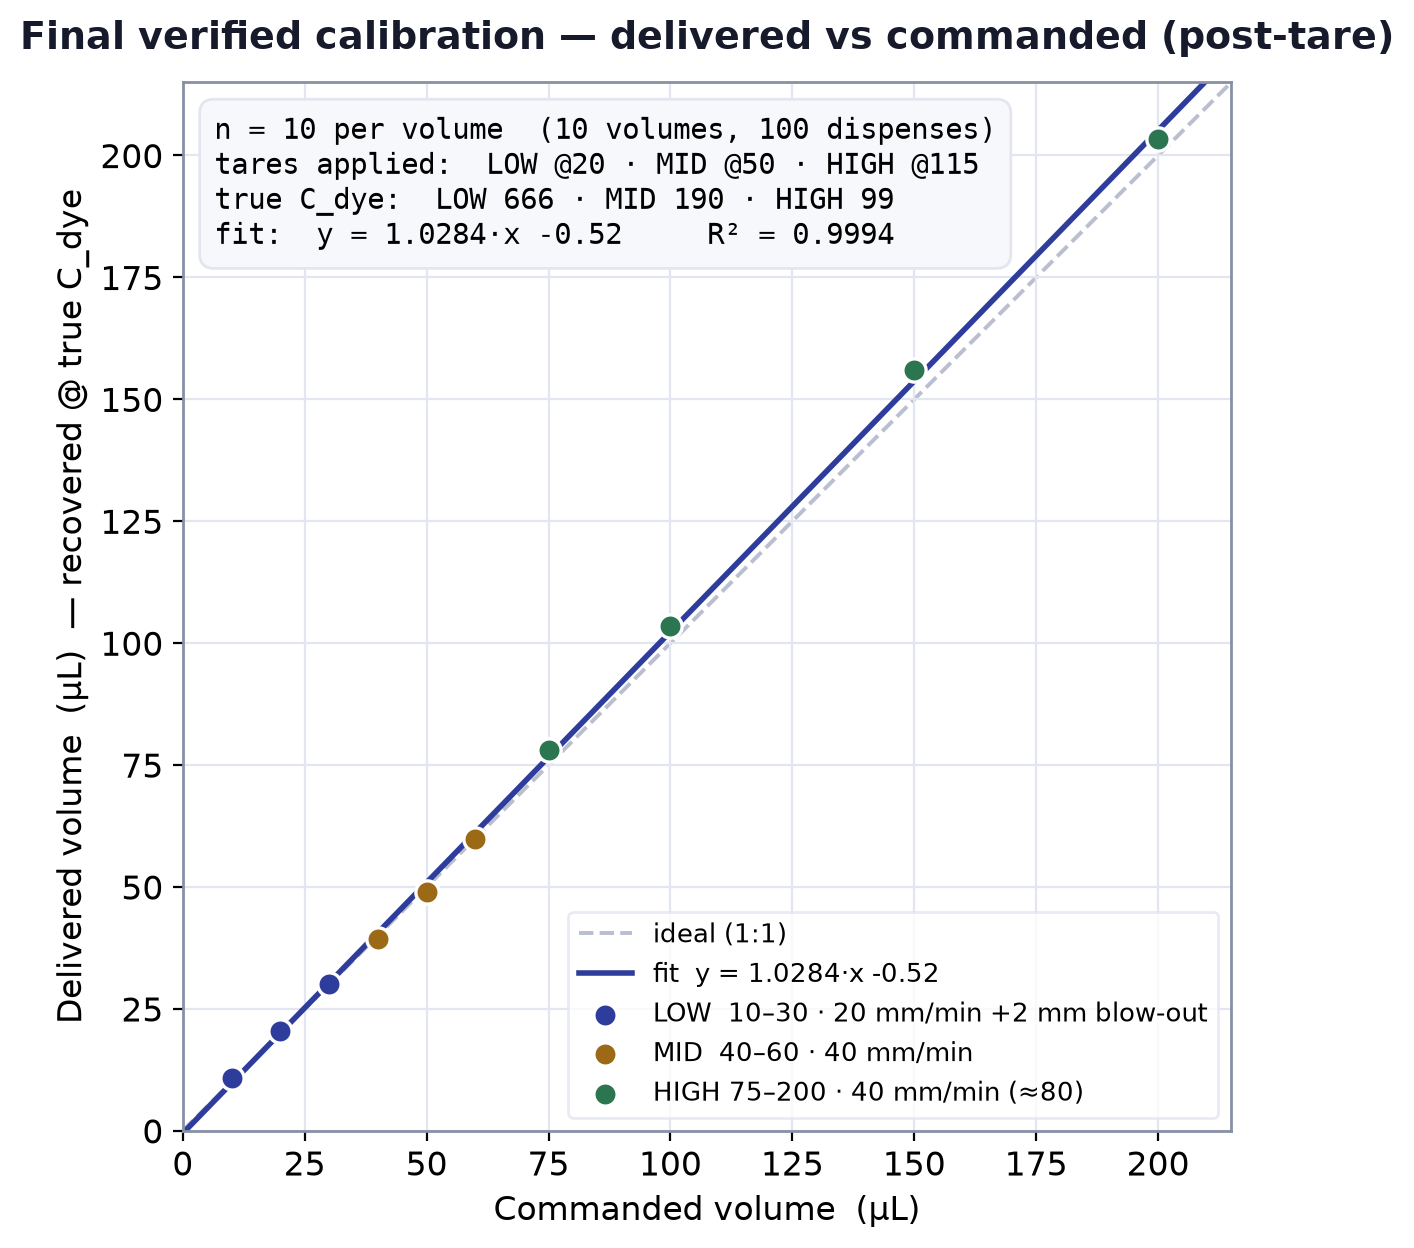
Ten volumes, ten replicate cuvettes each, every dispense recovered photometrically against the band's verified dye concentration.
| Commanded | n | Mean delivered | SD | CV % | Error | %d |
|---|---|---|---|---|---|---|
| Low band | ||||||
| 10 µL | 10 | 10.93 | 0.41 | 3.77 | +0.93 | +9.3% |
| 20 µL | 10 | 20.52 | 0.46 | 2.23 | +0.52 | +2.6% |
| 30 µL | 10 | 30.11 | 0.39 | 1.28 | +0.11 | +0.4% |
| Mid band | ||||||
| 40 µL | 10 | 39.26 | 1.32 | 3.37 | −0.74 | −1.8% |
| 50 µL | 10 | 49.04 | 1.14 | 2.33 | −0.96 | −1.9% |
| 60 µL | 10 | 59.90 | 1.38 | 2.31 | −0.10 | −0.2% |
| High band | ||||||
| 75 µL | 10 | 78.02 | 2.91 | 3.73 | +3.02 | +4.0% |
| 100 µL | 10 | 103.60 | 4.11 | 3.97 | +3.60 | +3.6% |
| 150 µL | 10 | 156.13 | 3.55 | 2.27 | +6.13 | +4.1% |
| 200 µL | 10 | 203.29 | 2.39 | 1.18 | +3.29 | +1.6% |
Pooled across all ten volumes: delivered = 1.0284 × commanded − 0.50 µL, R² = 0.9994. Per-band R² is computed on all 30–40 individual cuvettes, not the means.
Where the error actually lives
Accuracy and precision fail for different reasons and get fixed in different places, so they are worth separating. The second panel carries the more useful finding: for the low and mid bands the measured scatter is almost exactly one tick of the colorimeter's display, which means those CVs describe the meter, not the pump.
Accuracy
Mean deviation from the commanded volume, %d
Precision
CV% over ten cuvettes, against the meter's resolution floor
The low and mid bands were read at two decimal places, the high band at three. At 10 µL one 0.01 AU tick is worth 0.39 µL — 3.9% of the dispense — against a measured CV of 3.77%. The pump's real scatter is somewhere underneath that and was never resolved. In the high band, read at 0.001 AU, one tick is 0.2–0.4% and the measured 1.2–4.0% is genuinely the instrument.
A variance decomposition on the high-band data puts the 200 µL scatter entirely in the colorimeter, with the pump's contribution below the meter's floor; at 75–100 µL roughly 60–70% is machine and handling.
What these numbers do not say
Four limits worth stating plainly, because each one bounds how far the calibration can be trusted.
◆The 10 µL point is weak
It runs +9.3%, three times the error of any other volume. Taring off the mean of at least three reads rather than a single one brings it to roughly +4%. The original 5 µL target was never reached — that needs the trapped air column shrunk, which conflicts with keeping liquid out of the syringe for contamination reasons.
◆Aspiration was never measured
Every number here is a dispense. On aspiration the air spring expands rather than compresses, so the offset may not apply in the same size or even the same direction. It is unverified, not assumed equivalent.
◆Low and mid CVs are upper bounds
Both bands were read at a resolution coarse enough to alias the true scatter. The honest statement is that precision in those bands is no worse than the figures shown. Re-reading at 0.001 AU would settle it.
◆Photometry cannot isolate bias
A weak dye and an over-delivering pump read identically. Separating them needs a dye-independent anchor — a reference pipette into the same dye, or a large gravimetric accumulation. Here the two were told apart by a diagnostic: back-calculating the implied dye concentration at each volume, which trended 84 → 91 across the band rather than sitting flat, pointing to a real pump offset rather than a dilution error.